
Content block block-1688309582-1784250038
As described in the CA Master Plan on Aging, this goal frames health as a lifelong journey and strives to support aging adults in continuing to live well within their homes and communities of choice. The state’s goal addresses planning for chronic illnesses, gaps in home or community care, creation of healthy communities for residents across their lifespan, and systemic racism as evidenced through disproportionate death rates. Locally, planning began with asking OC older adults to describe their concerns. This section features rates for the health-related items only.
Content block block-463892357-1784250038
California Strategies for this goal are:
- Dementia in Focus
- Lifelong Health Aging
- Health Care as We Age
- Bridging Health with Home, including Culturally Responsive Services
- Nursing Home Innovation
Orange County Results

Key Findings
Although nearly all participants (97%) had health insurance, almost one-third identified high copays as a barrier from seeking medical care in the past 12 months. Participants also indicated they were prevented from receiving medical care due to availability and convenience of appointment times. However, it was not clear whether this was primarily due to waitlists (i.e., appointment scheduled too far out) or inconvenient hours of operation. While 8 out of 10 reported they were comfortable navigating healthcare resources on their own, participants also reported challenges in accessing medical and behavioral health care in the past year because they did “not know where to get help.” Thus, streamlining and simplifying the process of finding health information and resources could improve healthcare access for older adults, especially if provided in a variety of methods as not all older adults are comfortable utilizing technology and the internet. Finally, a little over half indicated that it was important to have care provided in the home, suggesting that identifying innovative and effective strategies for in-home services and making these resources more accessible and known to older adults as they age, will aid in filling this important need. A crucial aspect of this strategy will be to gather more information about its associated costs and the extent to which in-home services might be cost-prohibitive for some families.
Links in this section relate to BodyCommunity Ratings
Content block block-1056328597-1784250038
| Scale for Community Ratings Ratings of “good” and “excellent” by city of residence were averaged across cities and reported below. | ||
Low 0% - 30% |
Medium 31% - 60% |
High Over 61% |


Health Care
Content block block-1589823904-1784250038
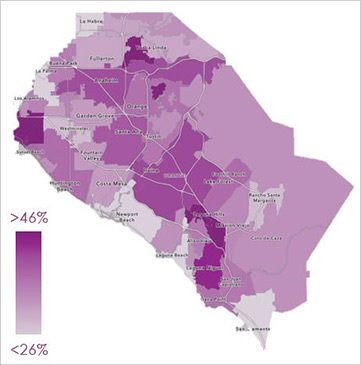
Availability of Affordable Health Care
36% Average |  Range of city ratings Range of city ratings |
Content block block-975231118-1784250038
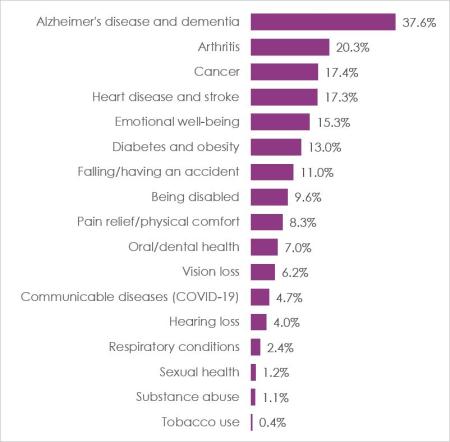
Health Concerns
| From a list covering health, lifestyle and social concerns the top concern was “Alzheimer’s disease and dementia.” |
Concern Ratings
Content block block-137000702-1784250038
| Scale for Top Concerns Percentages reflect how often an item was selected as one of a participant’s top three concerns from a list of 31 items. A total of 4,503 respondents selected their top three concerns and were included in the ratings. Rates ranged from 0% to a maximum of 38%. | |||||
 | Low 0% - 12% |  | Medium 13% - 25% |  | High 26% - 38% |
Memory
 | “Alzheimer’s Disease & Dementia”38% of participants identified as a top 3 concern |
Click on the category below to view percentages for subgroups with 100 or more responses.
Links in this section relate to BodyHealth
 | “Arthritis”20% of participants identified as a top 3 concern |
Click on the category below to view percentages for subgroups with 100 or more responses.
Links in this section relate to BodyHealth
| “Cancer”17% of participants identified as a top 3 concern |
Click on the category below to view percentages for subgroups with 100 or more responses.
Links in this section relate to BodyHealth
| “Heart Disease & Stroke”17% of participants identified as a top 3 concern |
Click on the category below to view percentages for subgroups with 100 or more responses.
Links in this section relate to BodyHealth
| “Emotional Well-Being”15% of participants identified as a top 3 concern |
Click on the category below to view percentages for subgroups with 100 or more responses.
Links in this section relate to Body