Content block block-1933292691-1784360601
As described in the CA Master Plan for Aging, this goal focuses on economic security which is essential to living and aging well. This goal recognizes changes in individuals no longer able to rely on their past income, which consisted of a combination of individual savings, employer-paid pensions and Social Security.
Content block block-399621621-1784360601
California Strategies for this goal are:
- End Older Adult Homelessness
- Income Security as We Age
- Protection from Poverty & Hunger
Orange County Results

Key Findings
Participants generally did not rate their communities favorably regarding financial or legal planning services and 15% of participants identified cost of living/economic instability as contributing to their medical and behavioral health concerns. In addition, those reporting the lowest household incomes (i.e., < $25,000 annually) were also the most likely to be concerned about making ends meet financially and about becoming homeless. From a long-term planning perspective, it is important to note that 59% of participants owned their own home and that home ownership rates were highest among participants in the older age groups. This suggests that as the Orange County population continues to age, there may be fewer homeowners over time and an increasing proportion of residents living in rental properties or other potentially less stable housing settings. As such, Orange County communities should consider identifying potential strategies on how to support the housing needs and housing stability of its residents, thereby maximizing their options for living and aging well in place.
Community Ratings
| Scale for Community Ratings Ratings of “good” and “excellent” by city of residence were averaged across cities and reported below. | ||
Low 0% - 30% |
Medium 31% - 60% |
High Over 61% |


Financial/Legal Planning
Content block block-608444224-1784360601
Financial or Legal Planning Services
30% Average | 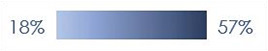 Range of city ratings Range of city ratings |
Content block block-115285918-1784360601
Content block block-739825545-1784360601
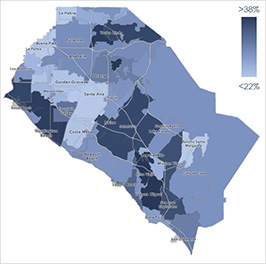
| Scale for Top Concerns Percentages reflect how often an item was selected as one of a participant’s top three concerns from a list of 31 items. A total of 4,503 respondents selected their top three concerns and were included in the ratings. Item selection rates ranged from 0% – 38%. | |||||
 | Low 0% - 12% |  | Medium 13% - 25% |  | High 26% - 38% |
Financial Security
 | “Not Being Able to Make Ends Meet Financially”14% of participants identified as a top 3 concern |
Click on the category below to view percentages for subgroups with 100 or more responses.
Links in this section relate to BodyUnhoused
 | “Becoming Homeless”5% of participants identified as a top 3 concern |
Click on the category below to view percentages for subgroups with 100 or more responses.
Links in this section relate to Body