
Content block block-369656067-1785073257
The County serves as a regional service provider and planning agency, delivering a broad spectrum of public and human services to more than 3.1 million residents. OC spans 798 square miles and includes 34 cities, several large unincorporated areas, nine beaches and 42 miles of coastline. OC has a high ratio of population per land area which made it the third most populous county in California (CA) as of 2021 and home to 8% of the State’s population. Located in Southern CA, OC has a desired climate and easy access to parks and beaches, providing residents with opportunities for outdoor activities and community engagement.
Links in this section relate to BodyOlder Adult Population
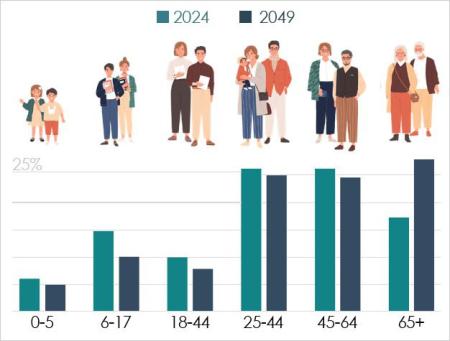
According to 2023 US Census estimates, adults aged 65 and above make up 17% of the total population. In this age group, 30% report disabilities.* Rates of disabilities are highest among those 75 years and above, which is 45%.
Among all age groups, 65 years and older is the only age group with a projected increase in population as calculated by the CA Department of Finance. Specifically, there will be a 66% increase by 2049 as shown in the figure to the right. Furthermore, according to the California Master Plan for Aging Data Dashboard (MPA-DD), by 2060, this age group is projected to be 36% of the total OC population which will outpace the overall projection of 33% for this age group within the State.
Links in this section relate to BodyContent block block-1551227097-1785073257
*Disability categories for Census Data include: hearing, vision, cognitive, ambulatory, self-care and independent living difficulty.
Older Adult Diversity
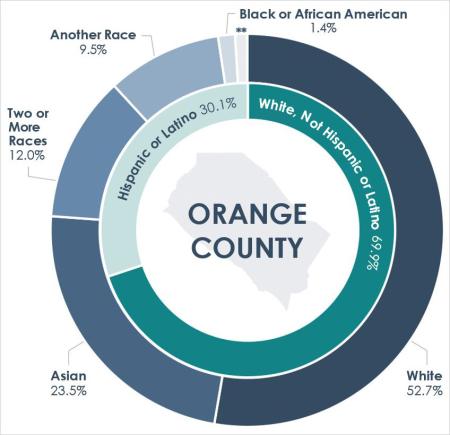
**American Indian & Alaska Native and Native Hawaiian & Other Pacific Islander represent under 1% of the population each.
Content block block-1074569955-1785073257
Top Cities with Largest Populations of Older Adults 1. Anaheim (62,598) Top Cities with Highest Percentages of Older Adults 1. Laguna Woods (92%) A table that provides all OC city populations is included in the Appendix of this document. |
Content block block-545692866-1785073257
Women comprise 54% of the OC population of 60 years and older, which is similar to CA (55%). While more than half identify as White (Non-Hispanic), OC has a diverse older adult population that will continue to diversify with individuals identifying with all other race and ethnicity categories.
Links in this section relate to Body