Content block block-1906961246-1775745472
As described in the CA Master Plan for Aging, this goal focuses on continuing, evolving and creating new opportunities for meaningful engagement at 60, 70, 80, 90 and 100-plus years old. This goal includes digital technologies, employment and volunteer opportunities. In addition, inclusion and equity for everyone includes ensuring the prevention of elder abuse which can take many forms including physical, sexual, abandonment, isolation, financial, neglect, self-neglect and mental suffering.
Content block block-1462154291-1775745472
California Strategies for this goal are:
- Inclusion & Equity in Aging
- Opportunities to Volunteer & Engage Across Generations
- Leadership in Aging
- Opportunities to Work
- Bridging the Digital Divide
- Protection from Abuse, Neglect & Exploitation
Orange County Results

Key Findings
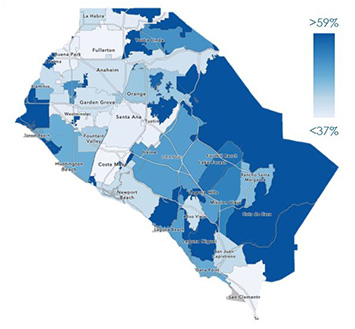
Nearly one-third of participants identified socialization groups as being an important service for older adults. Participants generally held favorable views of their cities regarding the social, religious, volunteer and other opportunities for involvement available. Participants also tended to rate their cities favorably on having public places in which to spend time, although ratings trended lower in central and north Orange County. Participants were consistent in not viewing their cities favorably on employment opportunities, with the lowest ratings observed in coastal and unincorporated areas. In addition, central and north Orange County cities trended lower in how open and accepting they were towards older residents of diverse backgrounds. Finally, more than half of respondents reported having experienced discrimination based on age (i.e., 70 years and older), race/ethnicity (i.e., Asians) and language (i.e., Korean, Spanish speakers) and nearly one in five participants said that “politics/political climate” contributed to their behavioral health conditions. Thus, to better support inclusion and equity for older adults, Orange County communities should consider strengthening existing and/ or building new support systems for social involvement in a safe and meaningful way for people from across all age groups, cultural backgrounds and inclusive of language access.
Community Ratings
| Scale for Community Ratings Ratings of “good” and “excellent” by city of residence were averaged across cities and reported below. | ||
Low 0% - 30% |
Medium 31% - 60% |
High Over 61% |


Community
Content block block-944707444-1775745472
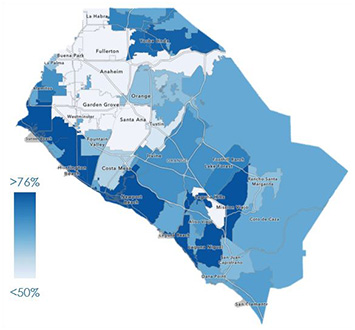
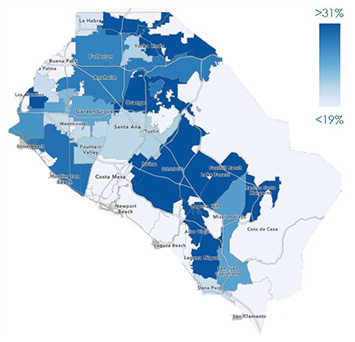
Openness and Acceptance of the Community toward Older Residents of Diverse Backgrounds
48% Average | 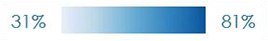 Range of city ratings Range of city ratings |
Content block block-1742184227-1775745472
Content block block-997275482-1775745472
Opportunities for Community Involvement
e.g., social, religious, volunteering, exercise classes, library services
63% Average | 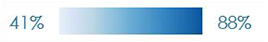 Range of city ratings Range of city ratings |
Content block block-1332828763-1775745472
Content block block-1466214720-1775745472
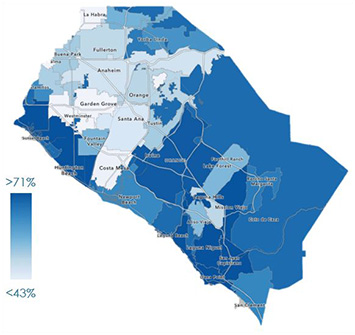
Public Places where People want to Spend Time
57% Average | 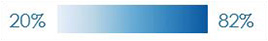 Range of city ratings Range of city ratings |
Content block block-1602991931-1775745472
Employment Opportunities
Quality & Variety of Employment Opportunities
25% Average | 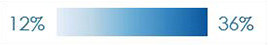 Range of city ratings Range of city ratings |
Content block block-2129992304-1775745472
Concern Ratings
Content block block-960444030-1775745472
| Scale for Top Concerns Percentages reflect how often an item was selected as one of a participant’s top three concerns from a list of 31 items. A total of 4,503 respondents selected their top three concerns and were included in the ratings. Item selection rates ranged from 0% – 38%. | |||||
 | Low 0% - 12% |  | Medium 13% - 25% |  | High 26% - 38% |
Loneliness
 | “Feeling Lonely & Isolated”6% of participants identified as a top 3 concern |
Click on the category below to view percentages for subgroups with 100 or more responses.
Digital Divide
| “Not Being Able to Use Technology”4% of participants identified as a top 3 concern |
Click on the category below to view percentages for subgroups with 100 or more responses.
Companionship
| “Losing Respect from Others”1% of participants identified as a top 3 concern |
Click on the category below to view percentages for subgroups with 100 or more responses.